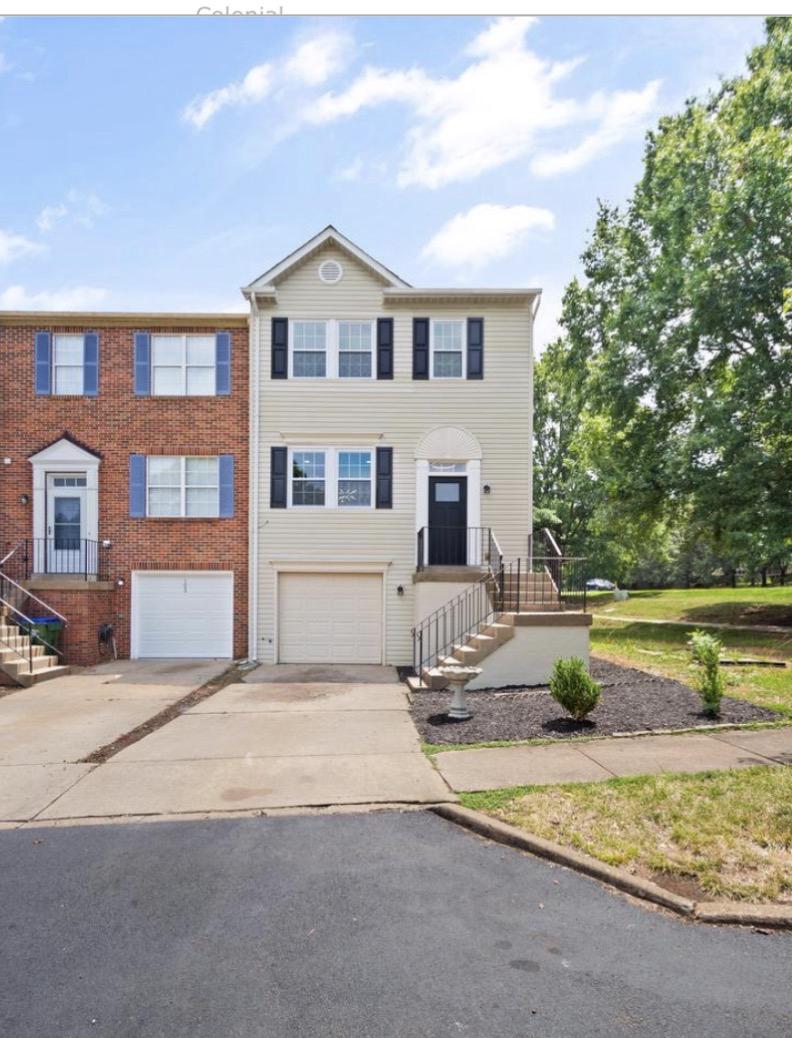
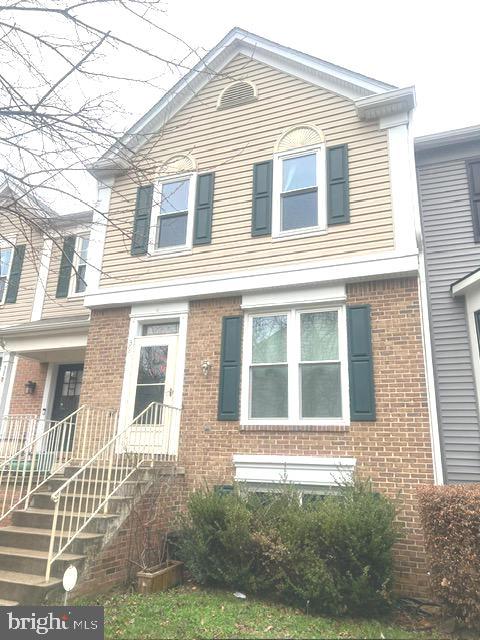
Spring Knoll is an amazing towhome community in England Run off Rt. 17, very close to I-95. This inviting subdivision offers three finished levels, many with at least three bedrooms and three full bathrooms.
606 people live in Spring Knoll, where the median age is 32 and the average individual income is $38,413. Data provided by the U.S. Census Bureau.
Total Population
Median Age
Population Density Population Density This is the number of people per square mile in a neighborhood.
Average individual Income
There's plenty to do around Spring Knoll, including shopping, dining, nightlife, parks, and more. Data provided by Walk Score and Yelp.
Explore popular things to do in the area, including Good In Good Out, Mechelle's Baking Company, and Duck Donuts.
| Name | Category | Distance | Reviews |
Ratings by
Yelp
|
|---|---|---|---|---|
| Dining | 4.7 miles | 7 reviews | 5/5 stars | |
| Dining · $$ | 3.23 miles | 16 reviews | 4.9/5 stars | |
| Dining | 3.75 miles | 7 reviews | 4.9/5 stars | |
| Dining | 4.55 miles | 6 reviews | 4.8/5 stars | |
| Nightlife | 4.15 miles | 6 reviews | 5/5 stars | |
| Beauty | 1.44 miles | 17 reviews | 5/5 stars | |
| Beauty | 4.55 miles | 22 reviews | 5/5 stars | |
| Beauty | 3.39 miles | 10 reviews | 5/5 stars | |
| Beauty | 4.56 miles | 6 reviews | 4.8/5 stars | |
| Beauty | 4.28 miles | 4 reviews | 5/5 stars | |
|
|
||||
|
|
||||
|
|
||||
|
|
||||
|
|
||||
|
|
Spring Knoll has 189 households, with an average household size of 3. Data provided by the U.S. Census Bureau. Here’s what the people living in Spring Knoll do for work — and how long it takes them to get there. Data provided by the U.S. Census Bureau. 606 people call Spring Knoll home. The population density is 14,624 and the largest age group is Data provided by the U.S. Census Bureau.
Total Population
Population Density Population Density This is the number of people per square mile in a neighborhood.
Median Age
Men vs Women
Population by Age Group
0-9 Years
10-17 Years
18-24 Years
25-64 Years
65-74 Years
75+ Years
Education Level
Total Households
Average Household Size
Average individual Income
Households with Children
With Children:
Without Children:
Marital Status
Blue vs White Collar Workers
Blue Collar:
White Collar: